Performance-Data-Visualisation
Overview
Based on the performance data, several useful charts have been created to visualise the results effectively. The choice of charts depends on the specific insights you want to highlight. Here are some useful charts:
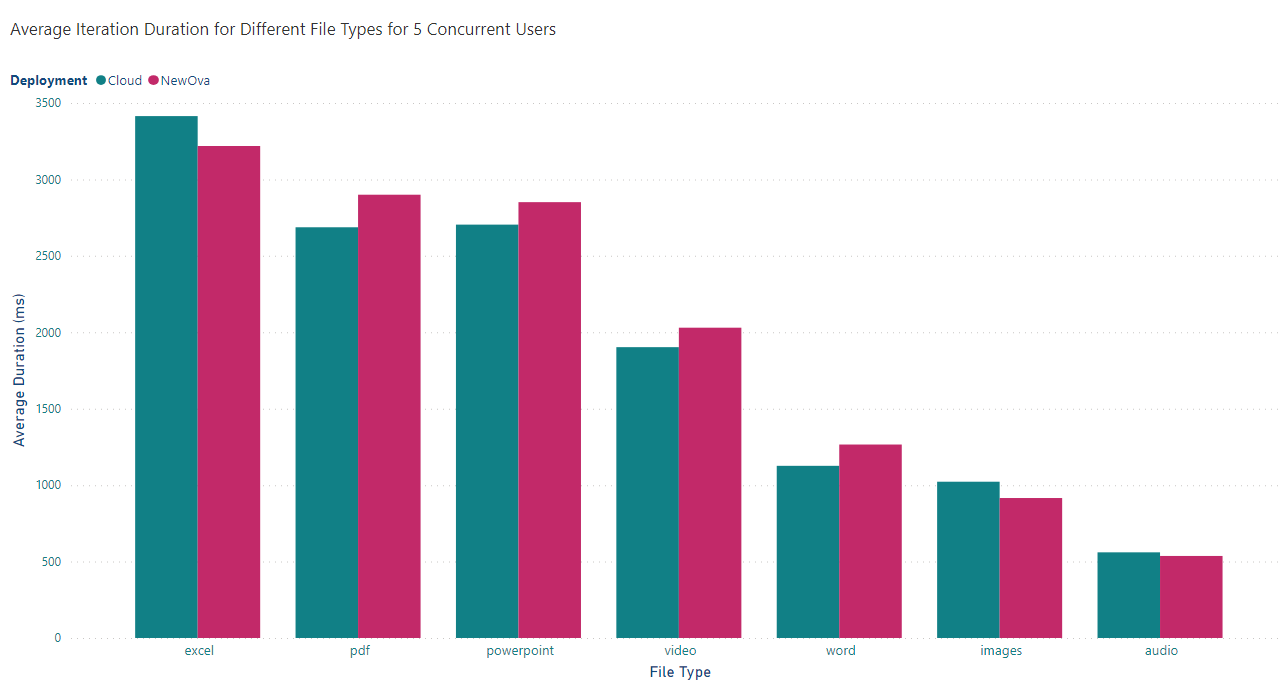
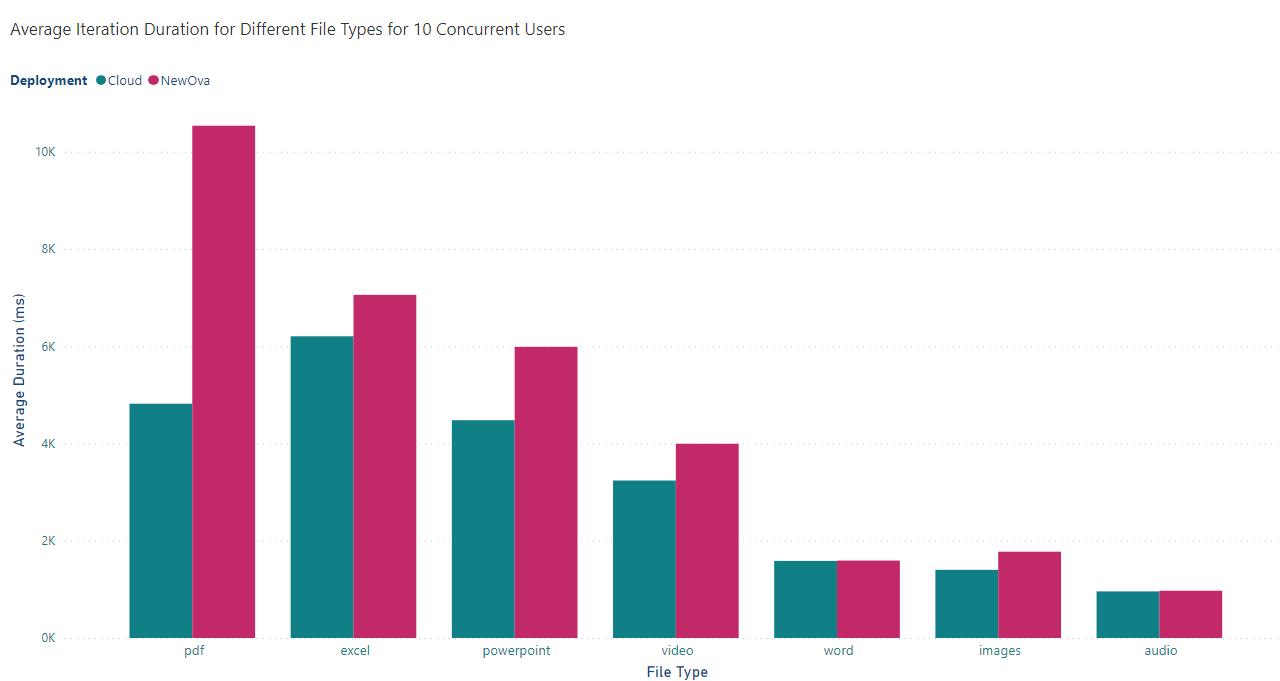
###Bar Chart - Average Iteration Duration for Different File Types:
These charts compare the average iteration duration for each file type across different versions (New OVA, Old OVA, Cloud) for both 5 and 10 users. They give a clear visual representation of which version performs better for each file type and user scenario.
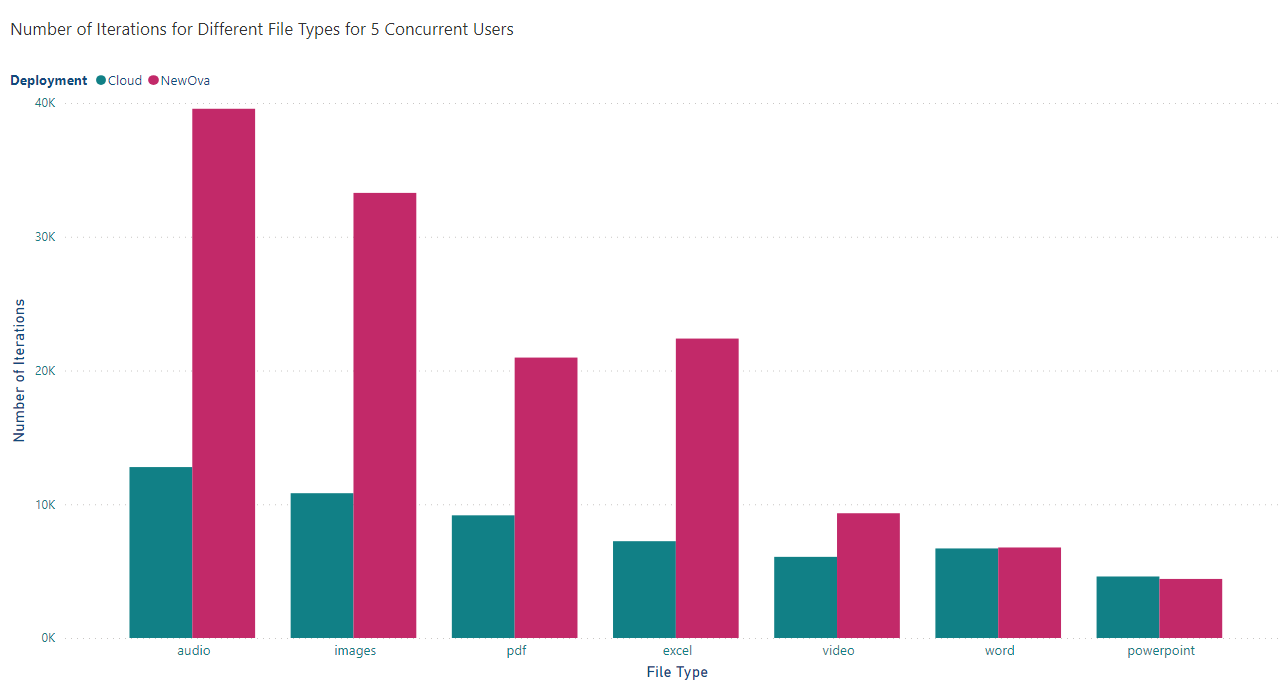
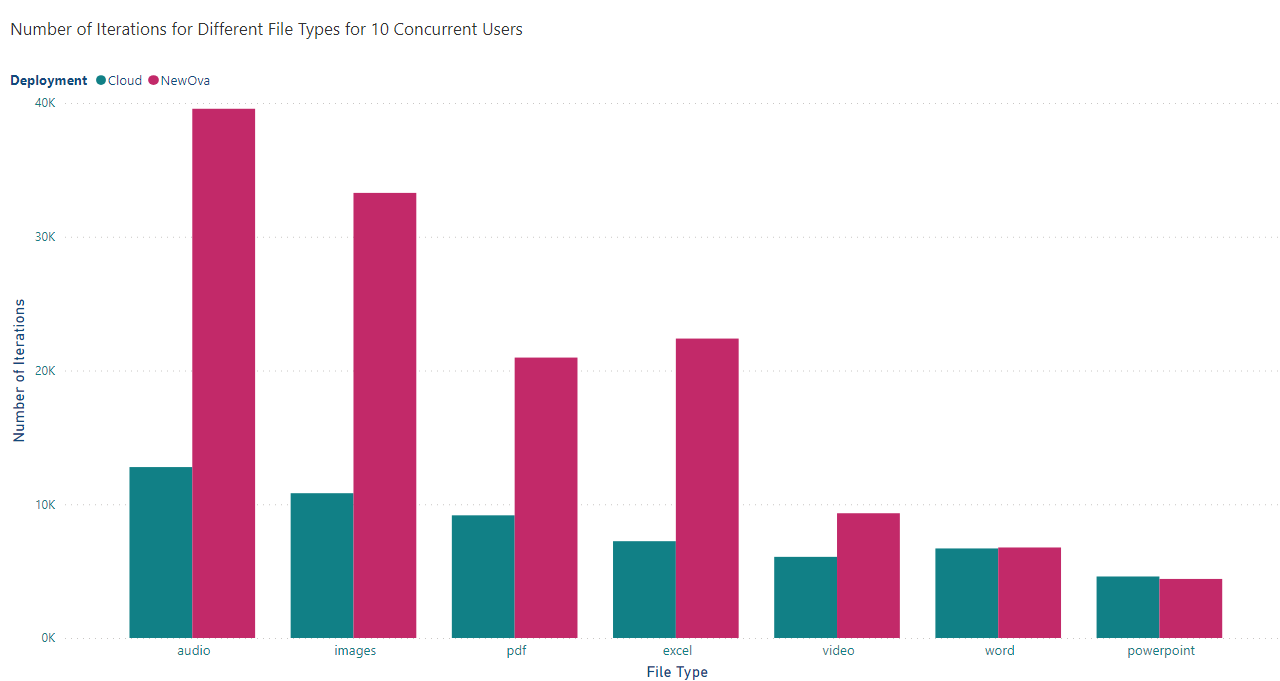
###Bar Chart - Iterations for Different File Types:
These charts compare the iterations for each file type across different versions (New OVA, Old OVA, Cloud) for both 5 and 10 users. They give a clear visual representation of which version performs better for each file type and user scenario.
Stacked Bar Chart - Average Iteration Duration Comparison for 5 and 10 Users:
This chart compares the average iteration duration for each file type and version between 5 and 10 users per deployment. It will help visualise how the performance changes with varying user loads across the deployments.
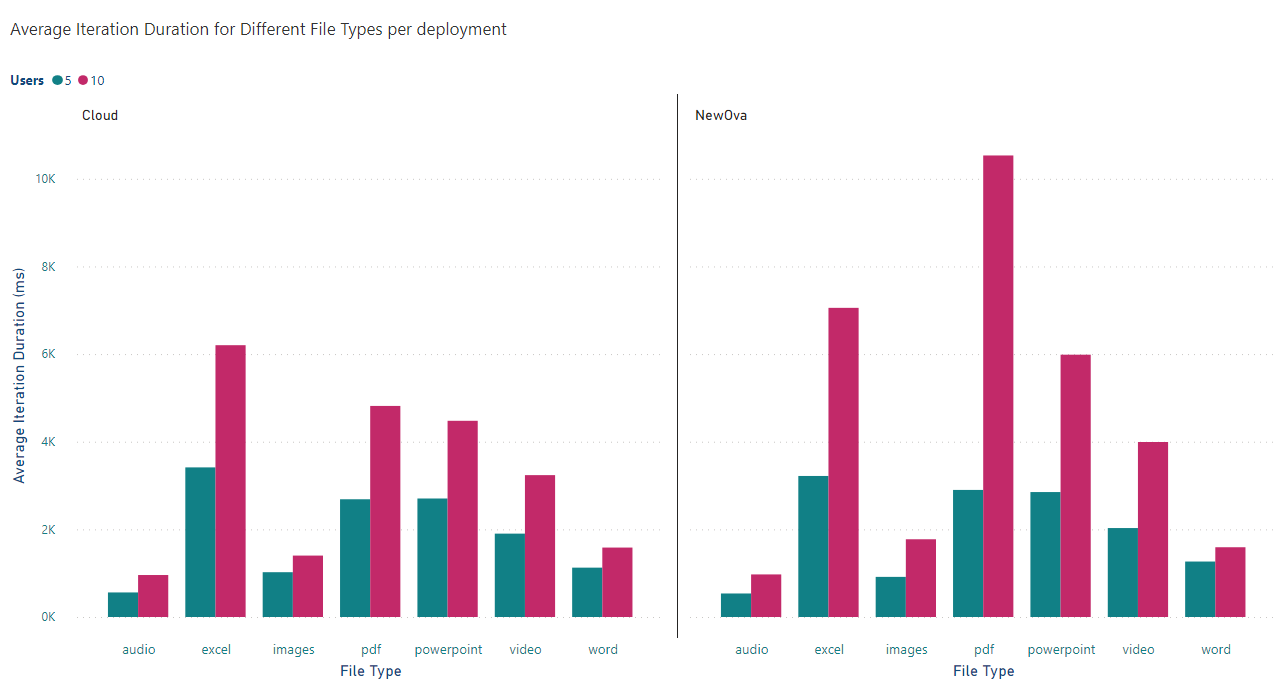
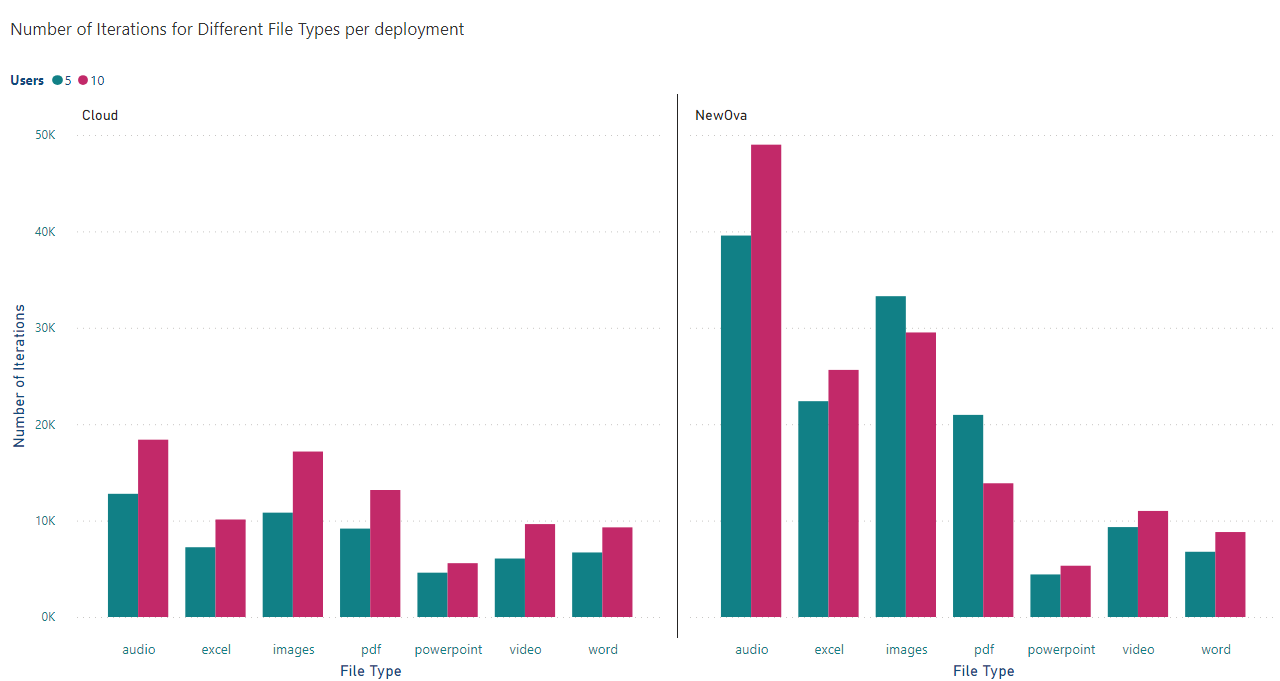
Stacked Bar Chart - Iteration Comparison for 5 and 10 Users:
This chart compares the number of iterations for each file type and version between 5 and 10 users per deployment. It will help visualise how the performance changes with varying user loads across the deployments.
You can download all these charts in PDF format Internal OVA Perf.pdf